Generate Work History Charts
This option allows you to create work database charts for a range of dates and a specified skill code. These charts give a summarized view of the performance of the workgroup. You can also use charts to compare the various activities of workgroups.
What do you want to do?
Tasks in this Topic Include:
Related Tasks:
- Import Work History
- Maintain Work History
- Copy Work History
- Generating Work History Reports
- Generate History
Access Charts
-
Select Reports from the Work History left-navigation menu.
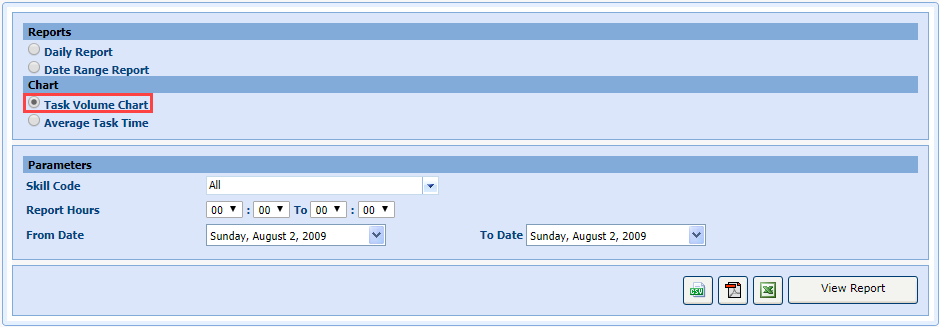
Generating Workgroup Task Volume Charts
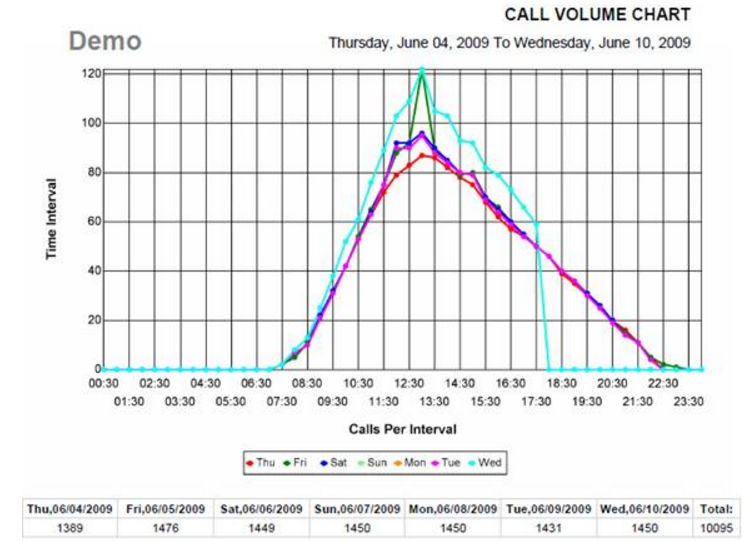
The Task Volume Chart feature creates a chart for the total number of calls received by a workgroup in the specified period. You can also create he chart for a particular skill code. You can use this chart to evaluate a statistical view of the average number of total calls received during a period, which cannot be more than a week.
- Select Task
Volume Chart.

- Select the skill code from the Skill Code drop-down menu.
- Set the work hours of a workgroup in the Reports Hours fields.
- Select the starting date for which you want to create the chart from the From Date drop-down menu.
- Select the ending date from the To Date drop-down menu.
- Select View
Report.
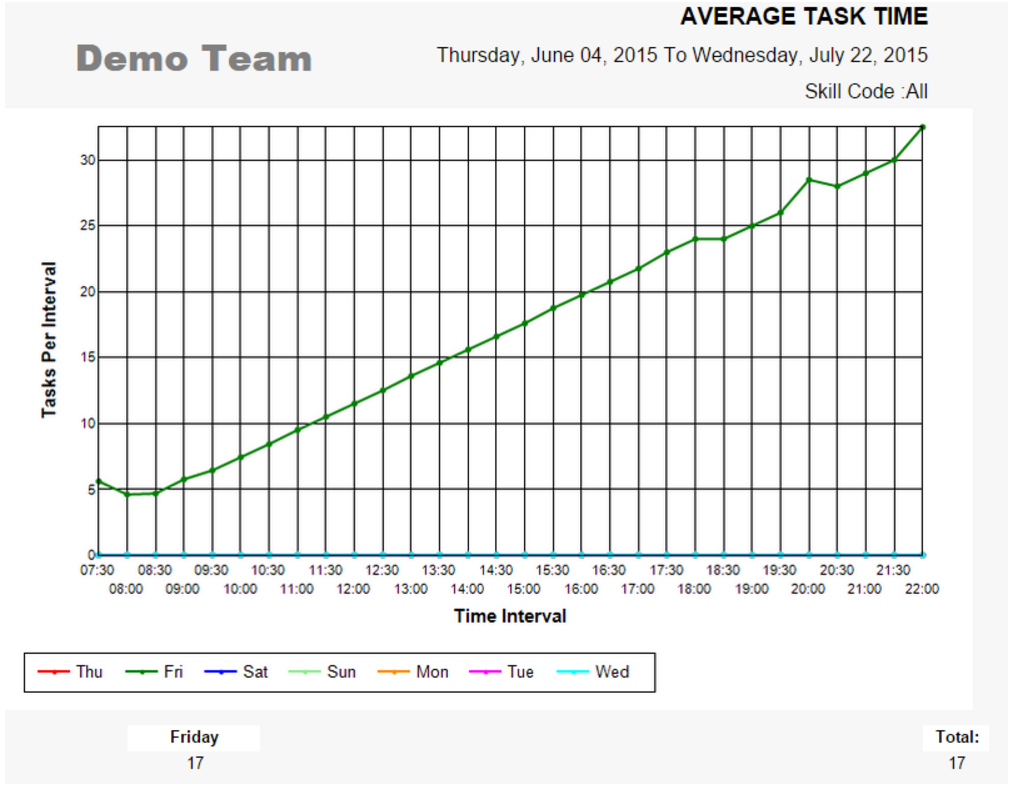
Generating Workgroup Average Talk Time Charts
The Average Talk Time Chart feature creates a chart depicting the average talk time of the workgroup. Using this information, you can change the service objectives of the workgroup. You can create a chart for a maximum period of one week.
- Select Average
Talk Time.
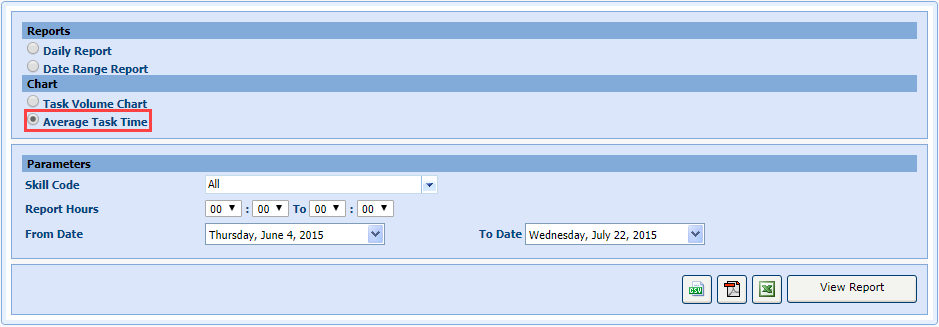
- Select the skill code from the Skill Code drop-down menu.
- Set the time in the Report Hours fields.
- Select the starting date for which you want to create the chart from the From Date drop-down menu.
- Select the ending date from the To Date drop-down menu.
- Select View Report.