Generating Forecasts
Forecasting in Monet is a multi-skill, multi-team, multi-time zone, omni-channel environment. Our simulation engine will return agent requirements on a 15-minute interval basis. Additionally, our simulation engine will allow you to target Probability of Threshold Delay, Average Speed of Answer, Abandon Percentage, or any combination of the three on an individual skill level. This means that we will return the number of agents you need to handle the expected workload at the service level you desire for every 15-minute interval of the day.
Unscheduled activities can be automatically accounted for to provide accurate staffing requirements based on realistic shrinkage expectations.
Additionally, agent requirements are returned per skill team to provide the most efficient staffing levels based on your agent abilities and hours of availability.
What do you want to do?
Tasks in this Topic Include:
- Use Historical Call Data for a Forecast
- Generating Forecasts
- Using the Selected Forecast Data Graph
- Adjusting the Forecast
- Editing Selected Historical Dates
- Using the Historical Date Selection Section
- Apply Total Day Changes to a Forecast
- Adjusting Volume or AHT
- Generating Forecasts
- Change Weight for a Date
- Apply Distinctive Day
Tasks in this Topic Include:
- Distinctive Day Codes
- Change Forecasts
- Delete Forecasts
- Generating Daily Forecast Reports
- Import Volume or Requirements Data
Watch and Learn:
Use Historical Call Data for a Forecast
- Select Forecast from the left-navigation menu.
- Select the Generate Forecast option.
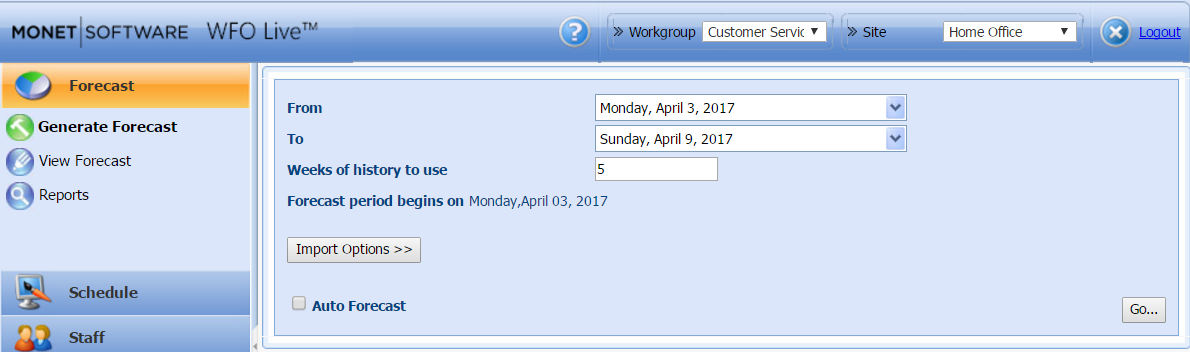
- Select the date span to forecast for in the From and To drop-downs menus.
- Enter the number of weeks of history in the Weeks of history to use field.
- Select Go....
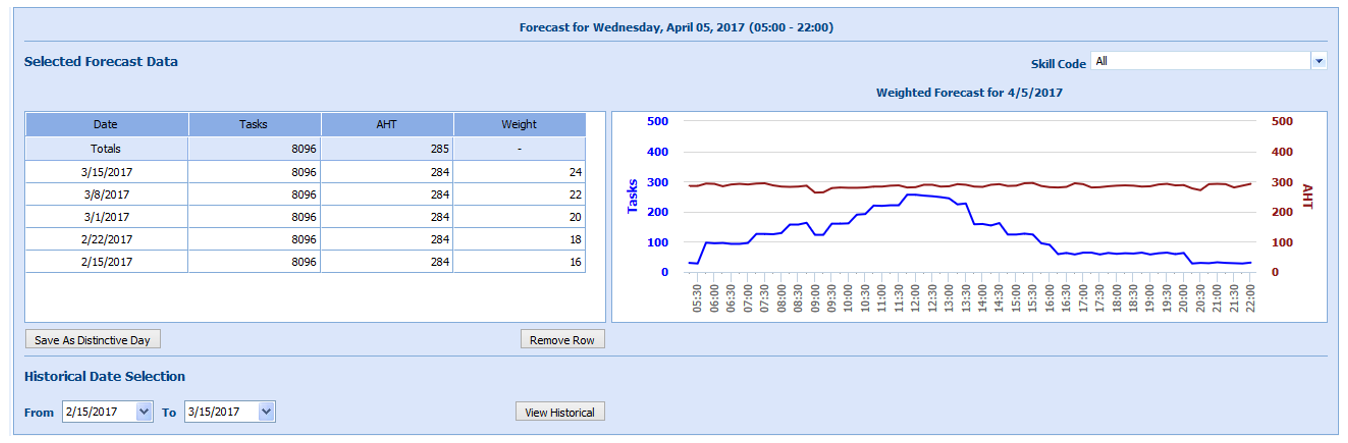
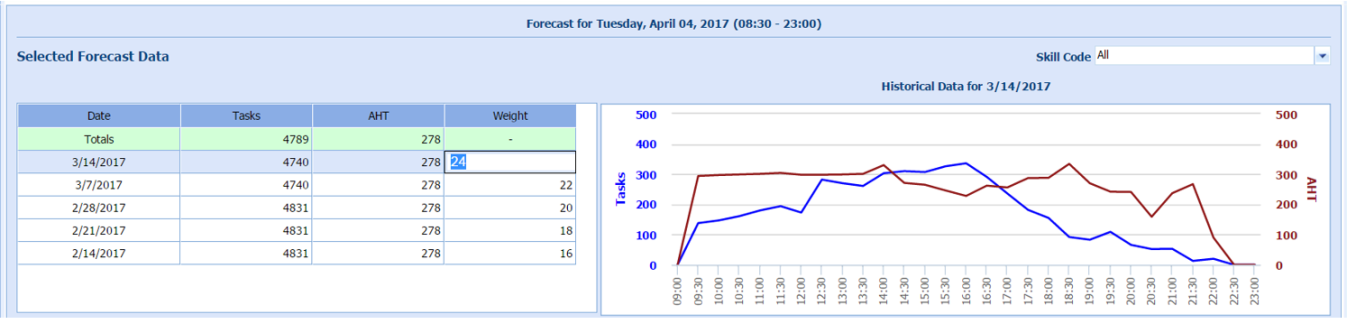
The forecast is displayed in the Selected Forecast Data table:
Using the Selected Forecast Data Table
The table is automatically loaded with the historical dates corresponding to the first weekday in the forecasting date range (Mondays for Monday, Tuesdays for Tuesday, etc.). The number of days shown will reflect the number of weeks selected on the previous page. To remove a specific date, highlight that row in the table, and click Remove Row. Note that the weight will automatically re-populate with one less row of data. Selecting a specific skill or skills in the Skill Code field will show you the Tasks and AHT for the selected skill or skills.
Using the Selected Forecast Data Graph
This graph will plot out the interval level data corresponding to the row selected in the Table. With the Totals row selected, the graph will show the projected forecast for this day. Selecting individual date rows will return the arrival pattern for that date. Use this functionality to help you select appropriate days of history to use in your forecast.
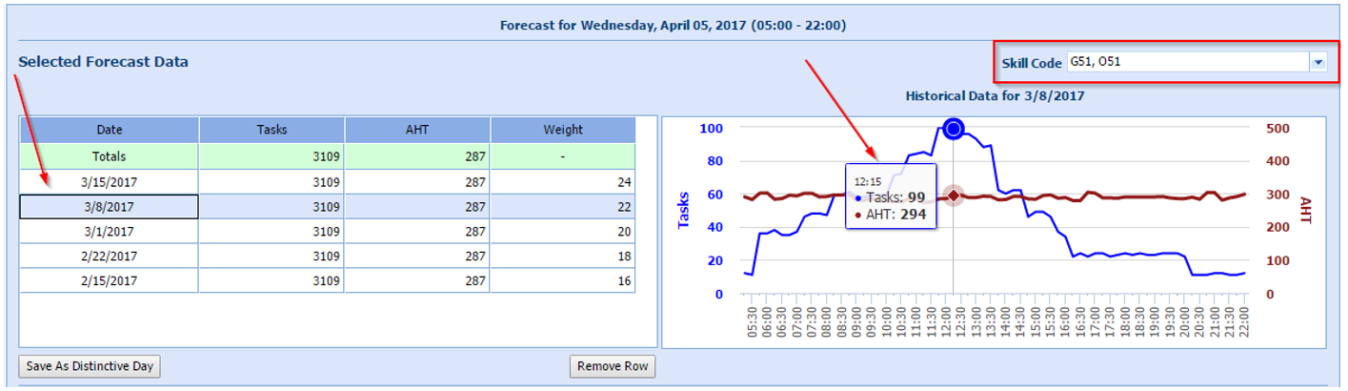
Hovering over the graph will show you the exact Tasks and AHT for the interval your mouse is resting over. Additionally, this graph will scale up or down depending on the amount of screen space available, and scale to the available screen space. More screen space will allow you to view this graph in 15-minute intervals. Each of the supported browsers will adjust the graphs differently; so feel free to experiment with Chrome, Firefox, Safari, or Explorer to understand the differing behavior.
Monet will automatically populate the forecast with the most recent historical data; however, adjustments often need to be made. This can be achieved by selecting alternative historical dates, adjusting the weight applied, and using Total Day changes to account for adjustments not accounted for in recent historical data.
- Adjusting the Forecast as desired:
- Monet presents the user with several opportunities to adjust the forecast before generation. Continue to make adjustments as required.
- Editing Selected Historical Dates
- Apply Total Day Changes to a Forecast
- Change Weight for a Date
- Apply Distinctive Day
- Select Generate to generate the forecast for the selected day with the parameters selected; or Skip this Date to not generate a forecast for the current date, and move to the next date in the forecast span.
- Continue selecting Generate, or Skip This Date until the forecast for all days in the forecast range are generated.
- When the end of the forecasting process is complete, the application returns you to the original input screen.
Adjusting the Forecast
The forecast can be adjusted:
Editing Selected Historical Dates
This section will present options for selecting alternate historical data for use in your forecast. When you first come to this page, the Historical Date Selection section is condensed.
To populate the Historical Date Selection table:
-
Select the From and To dates from the calendar pickers, or leave the default selection.
-
Select View Historical to expand and populate the Historical Date table.
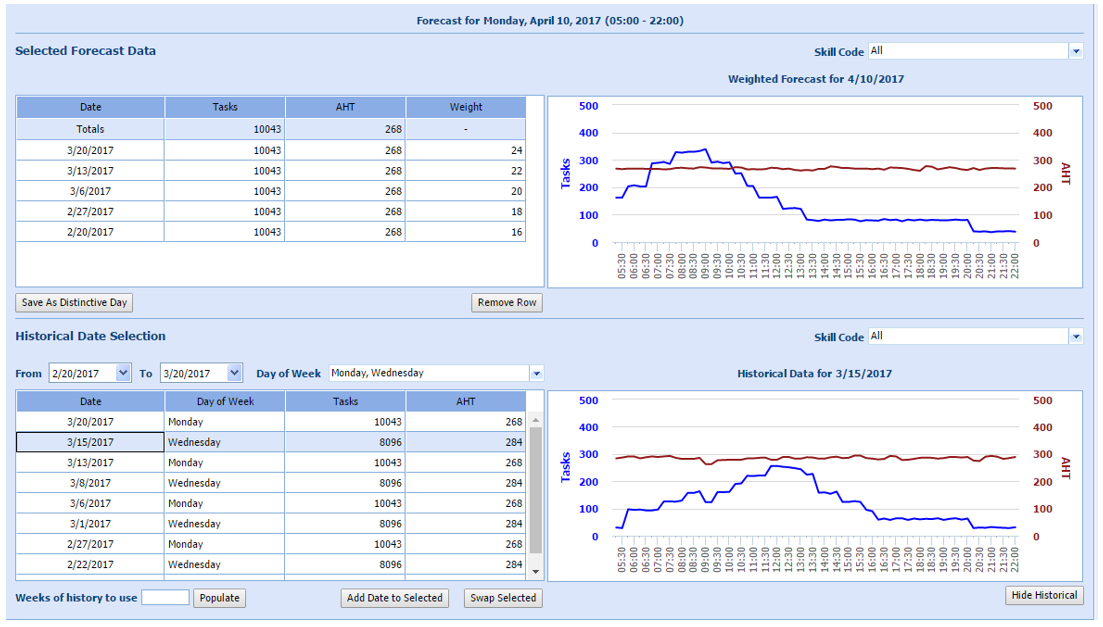
Using the Historical Date Selection Section
Selecting the View Historical button will automatically populate all current weekdays between the date range selected. So, if you are forecasting for a Tuesday, all Tuesdays between the From and To dates will populate. You can change the dates shown by changing the From and To date range, or selecting different weekdays in the Day of Week drop-down menu.
Entering a number between 1 and 30 in the Weeks of history to use field will automatically populate this table, as well as the Selected Forecast Data table, with the most recent historical data corresponding to the number of weeks selected.
Selecting specific rows of data will plot the graph to the right with the interval level data for Tasks and AHT. Use this feature to allow you to pre-screen historical dates before adding them to your forecast. Use the Skill Code filter to select specific skills to view.
To collapse this section, click Hide Historical.
There are two ways to apply a date to your Forecast:
-
Highlight a date in the Historical Data Selection table, and click Add Date to Selected. This will apply this date to your forecast and update the weight calculation automatically.
-
Highlight a date in the Historical Data Selection table and a date in Selected Forecast Date table, and click Swap Selected. This will replace the existing date in your forecast with the row selected in Historical Date Selection. No change to the weight is required, as the number of rows remains the same.
To retain your selection across different daily forecasts and have Monet increment the selection, check the Incremental Date Selection checkbox. Monet will then add a day to each date in the Selected Forecast Data table as you move through your selected date range. This will keep the appropriate weekday selection, and retain the Monday for Mondays and Tuesdays for Tuesdays behavior (unless you have manually selected different days of the week).
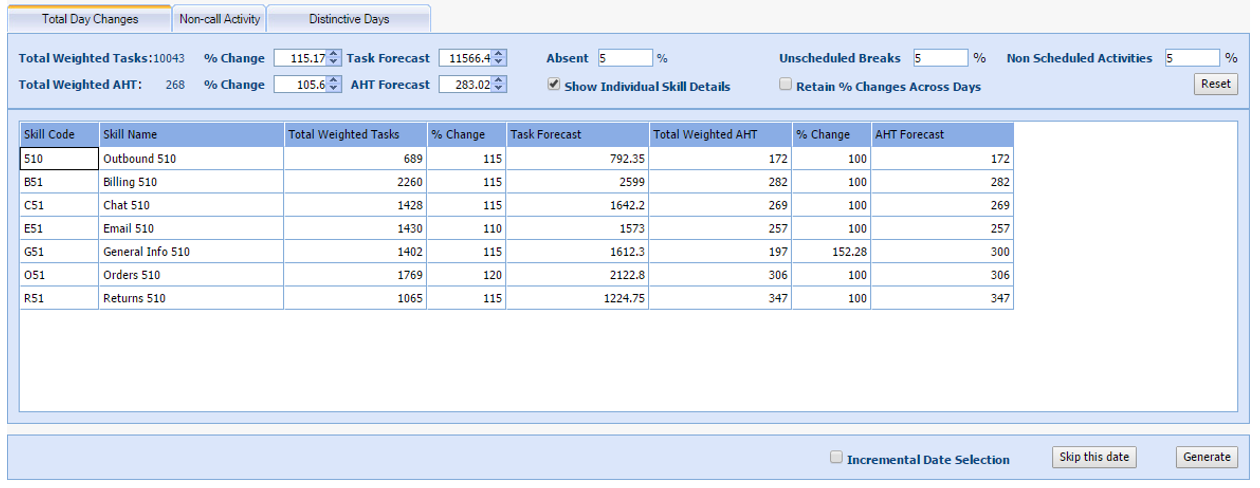
Apply Total Day Changes to a Forecast
Monet allows you to adjust forecast parameters before generating a forecast to account for changes to your expected volume, or handle time not represented in your historical data.
To apply Total Day Changes:
-
Select the Total Day Changes tab.
Adjusting Volume or AHT
You can apply an overall percentage change to all skills across the day by using the % Change fields for both Volume and AHT. This field will default to 100%, as this indicates no change made to the forecast. To reduce your Forecast Volume or AHT, enter a number below 100. For example, entering 90 will return 90% of the original value (10% decrease) to your Volume or AHT. To increase your Forecast Volume or AHT, enter a number over 100. For example, entering 120 will return 120% of the original value (20% increase).
To apply a specific value to your Volume or AHT, use the Task Forecast and AHT Forecast fields to provide Monet with a specific value. Monet applies that overall Volume or AHT across skills and intervals per the arrival pattern that currently exists.
These changes can be made by either clicking the up or down arrows in the % Change fields and Task/AHT Forecast fields, or typing in a specific number directly.
To make changes to individual skills, click the Show Individual Skill Details checkbox. This will expand the Total Day Changes to include a table with all skills shown automatically populated with the forecasted Volume and AHT. Apply % changes or overall totals to individual skills directly within the table.
Adjusting Shrinkage
You can adjust the shrinkage for the forecasted day by updating the Absent, Unscheduled Breaks, and Non Scheduled Activities fields. These fields are automatically populated with your default shrinkage settings. These changes will not be retained across multiple days, and will always revert to the default settings.
Changes made in the Total Day Changes are reflected in the graph of the Selected Forecast Data section. You can view graphically the effect that your total day changes have on your forecast before generating. If changes made are not as expected, you can click the Reset button to revert to the default settings.
Change Weight for a Date
You can change the weight for any date in the forecast.
To edit the weight in the Selected Forecast Data table:
- Double-click
into the Weight cell of the date to edit.
- Enter the new weight.
- Select outside the cell to update to the new value.
- Continue Generating a Forecast.
Apply Distinctive Day
To apply an existing Distinctive Day for use in your forecast:
- Select the Distinctive Days tab.
- Select the desired code from the Distinctive Day Code drop-down menu.
- Select Apply. The Selected Forecast Data table will populate with the distinctive day selected.